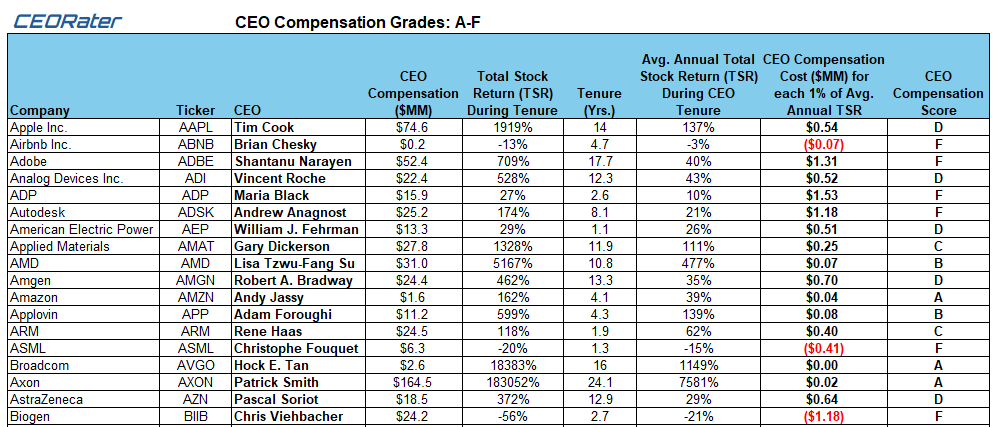
CEO Compensation Scores. Who Passed?

We scored, or perhaps more specifically graded NASDAQ 100 CEOs on an A-F scale
Calculation Method
The score is based on our existing "CEO Compensation Cost for each 1% of Average Annual TSR" metric, which divides total CEO compensation by the average annual total shareholder return (“AATSR”) during the CEO's tenure. If a CEO’s AATSR is negative, he/she automatically get an “F” grade.
Grading Scale
CEOs receive letter grades based on the following compensation efficiency thresholds:
Grade A (Exceptional Value): $0.000 - $0.050 million per 1% TSR
Grade B (Good Value): $0.051 - $0.200 million per 1% TSR
Grade C (Fair Value): $0.201 - $0.500 million per 1% TSR
Grade D (Poor Value): $0.501 - $1.000 million per 1% TSR
Grade F (Unacceptable): Above $1.000 million per 1% TSR
Interpretation
Lower compensation costs per unit of return indicate more efficient CEO compensation structures, representing better value for shareholders.
See the full list HERE.