Inflation In Pictures


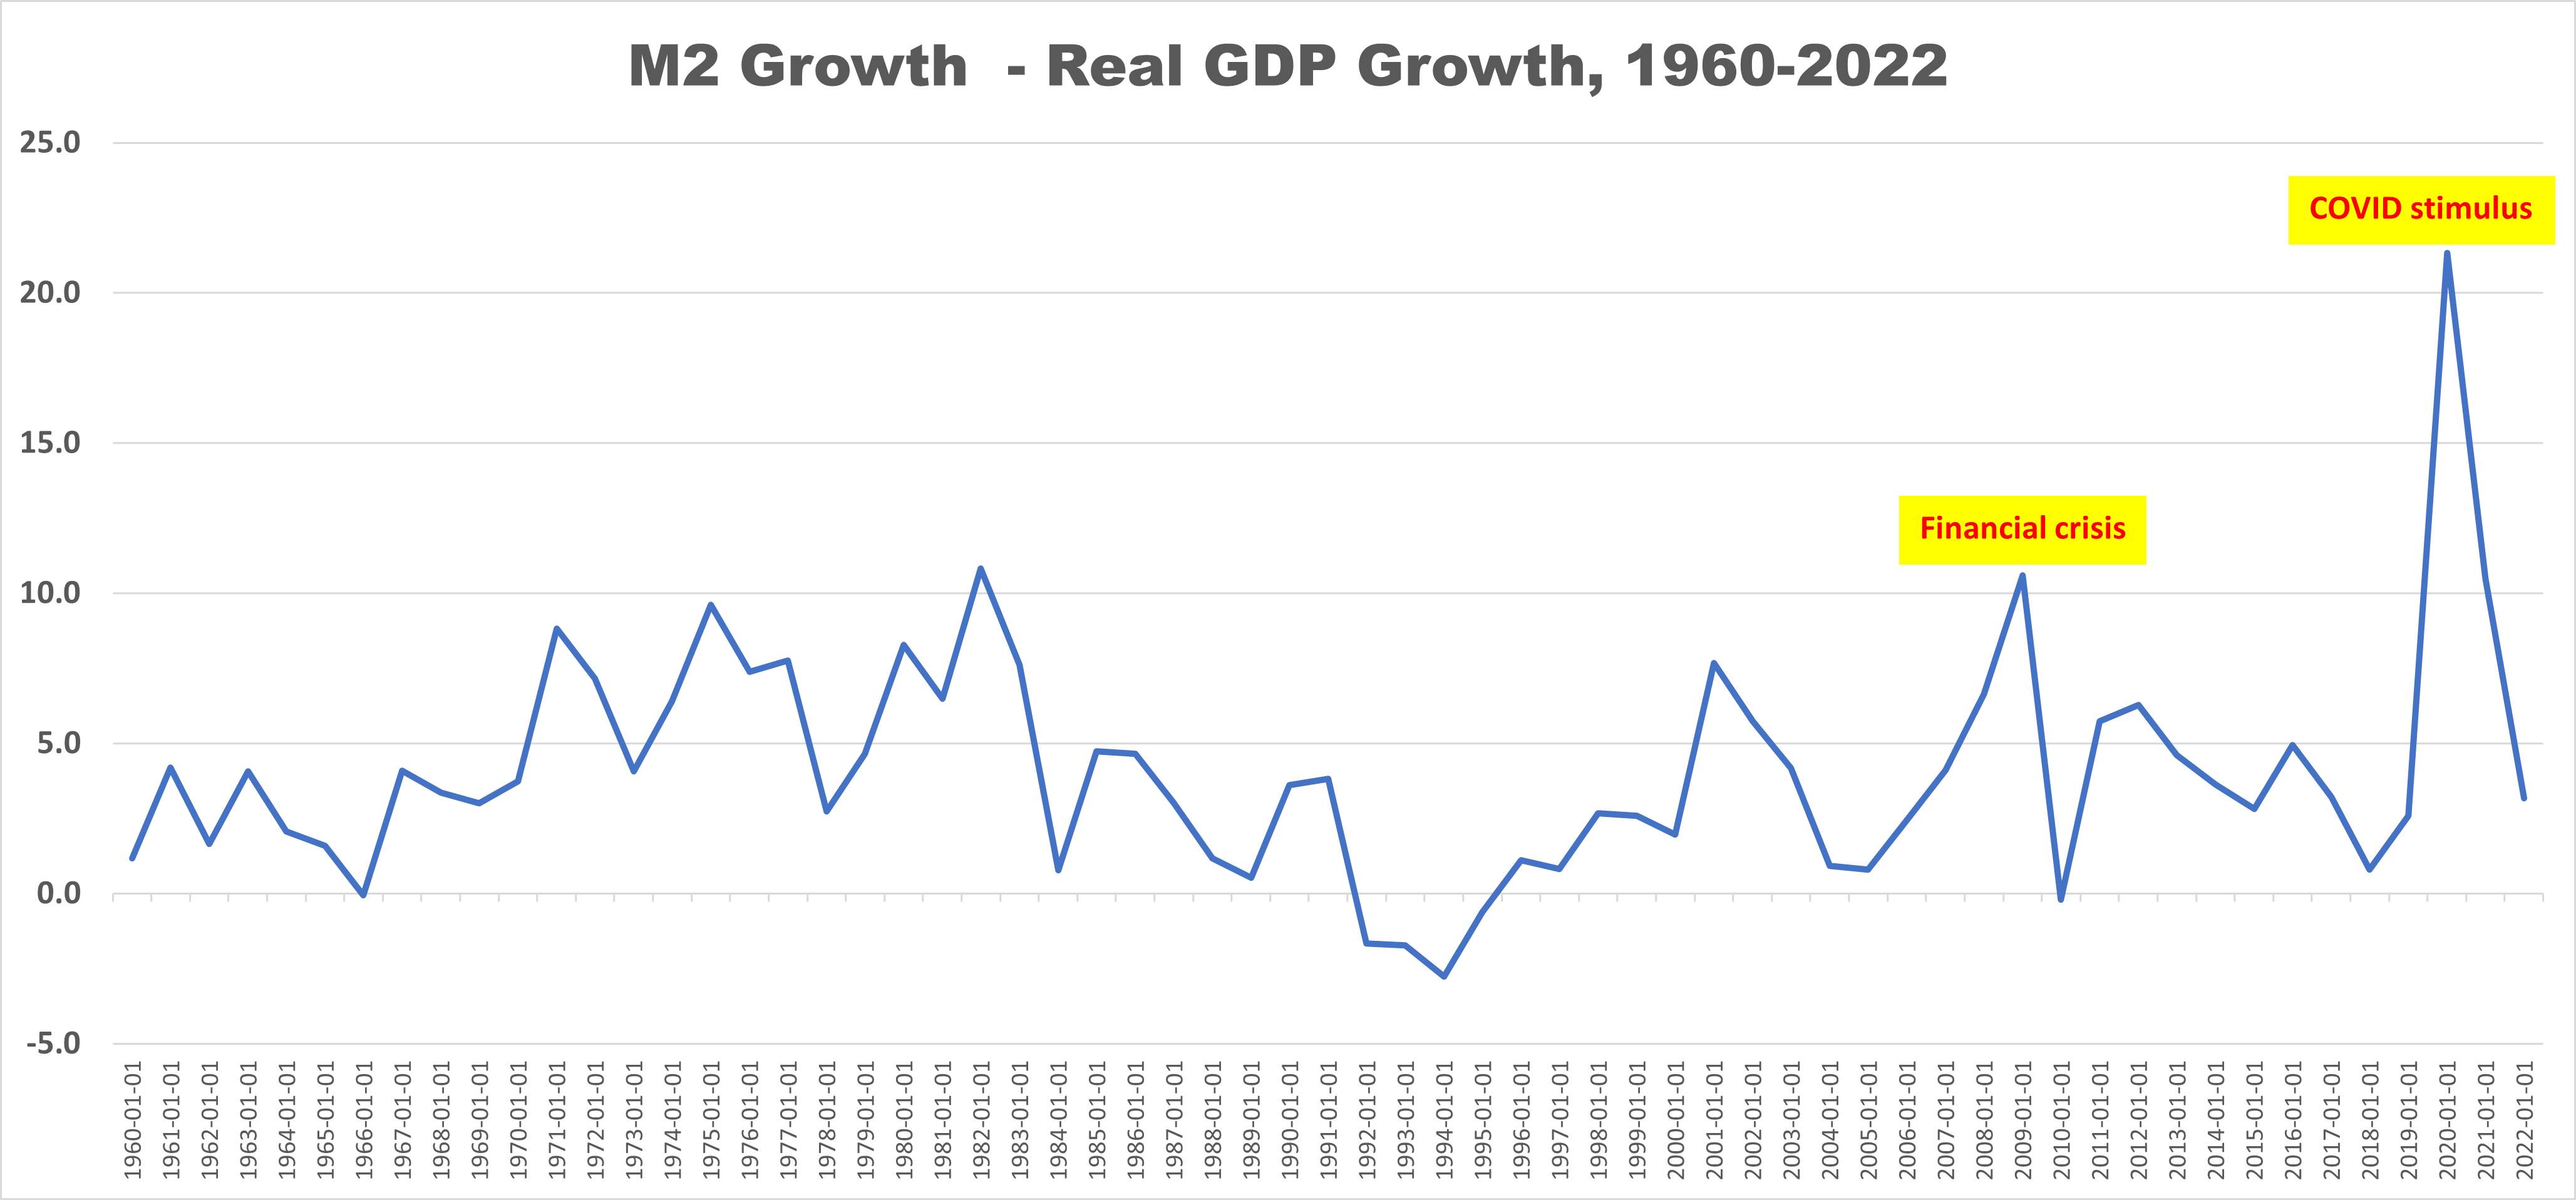
One measure of inflation is to compare growth in the money supply to GDP growth. Money supply growth should not exceed economic growth. When money supply growth exceeds economic growth, that resulting “slack” is inflation. Written another way, inflation exists when the money supply grows faster than GDP.
Below we plotted M2 percentage growth less Real GDP percentage growth on an annual basis from 1960-2022. Inflation exists wherever a positive value exists on the chart.
The two greatest inflationary in periods in recent years were created by the Fed’s response to the 2008-2009 financial crisis and by the Fed’s 2020-2022 COVID response (its own direct monetary policy initiatives combined with its efforts to subsidize fiscal spending).
The problem is that while the pace of inflation has abated over the past year, the value of the Dollar has permanently eroded. Think of each of the positive values on the chart as moments in time when the Dollar lost a portion of its purchasing power. The negative cumulative effect of these inflationary hits is devastating in terms of the Dollar’s lost purchasing power.