Recessions Happen When Fed Funds Exceeds Personal Savings

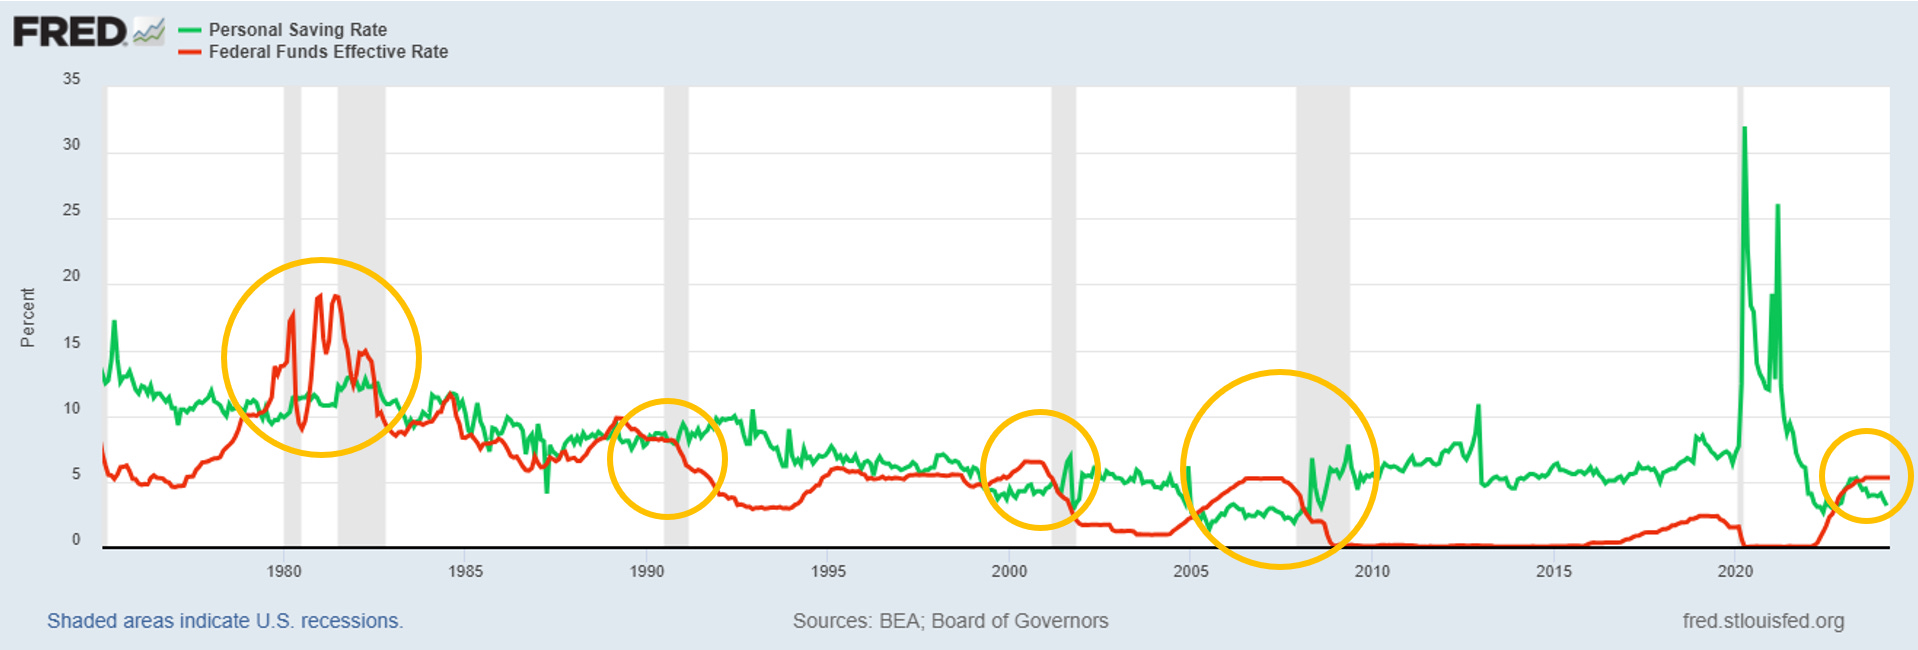
One may play with various permutations of the Personal Savings Rate vs. the Unemployment Rate vs. Debt Service Payments as a Percentage of Disposable Income to try to come up with some leading indicator of recession. None of those calculations work. However, when the Fed Funds Rate exceeds the Personal Savings Rate, recession typically follows.
I’ve highlighted those instances with five gold color circles in the chart below.
The first circle covers two recessions (marked by the gray shaded columns) when then Fed Chairman Paul Volcker lifted Fed Funds to around 18% to fight price inflation. The Fed Funds Rate first exceeded the Personal Savings Rate in June 1979, then did so again from August 1979 through April 1980, then did so again from October 1980 through November 1981, then did so again from January 1982 through July 1982.
The second circle depicts the period where Fed Funds exceeded Personal Savings from December 1988 through January 1990.
The third circle depicts the period where Fed Funds exceeded Personal Savings from April 1999 through March 2001.
The fourth circle depicts the period where Fed Funds exceeded Personal Savings from February 2005 through January 2008.
The fifth circle depicts the recent period where Fed Funds has exceeded Personal Savings beginning in October 2022 through December 2022 and again from June 2023 through today. Fiscal stimulus such as the CARES Act and the Employee Retention Credit artificially goosed the Personal Savings Rate, but those programs are running in fumes. The ERC ended in September 2023.